Overview
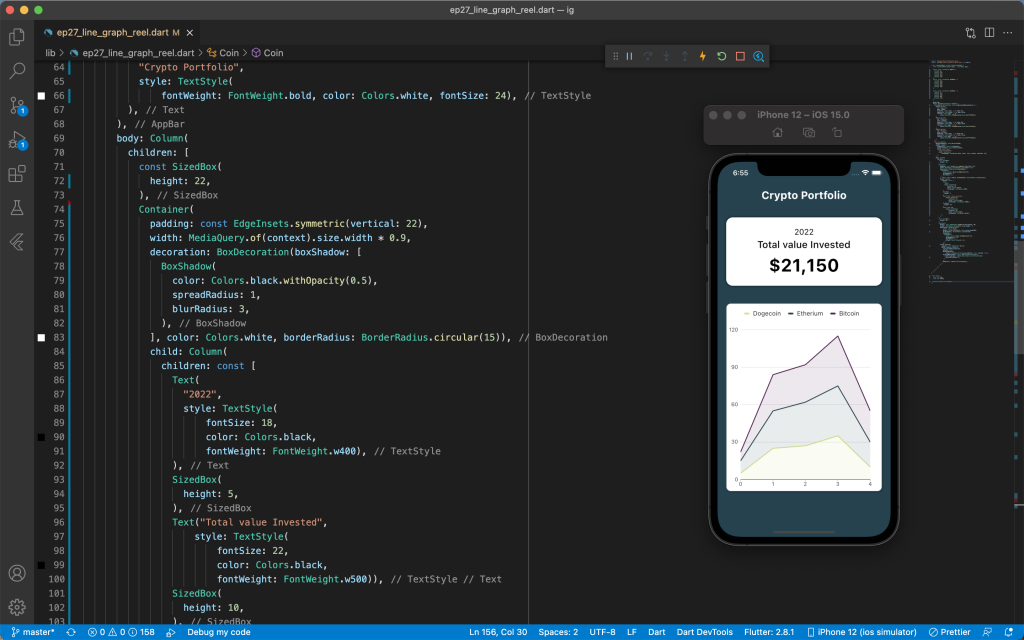
Today we build Line chart using Flutter and charts library
Source Code
import 'package:flutter/material.dart';
import 'package:charts_flutter/flutter.dart' as charts;

class LineGraphReel extends StatelessWidget {
  const LineGraphReel({Key? key}) : super(key: key);

  static final List<Coin> dData = [
    Coin(0, 5),
    Coin(1, 25),
    Coin(2, 27),
    Coin(3, 35),
    Coin(4, 10),
  ];
  static final List<Coin> ethData = [
    Coin(0, 10),
    Coin(1, 30),
    Coin(2, 35),
    Coin(3, 40),
    Coin(4, 20),
  ];

  static final List<Coin> bitData = [
    Coin(0, 7),
    Coin(1, 29),
    Coin(2, 30),
    Coin(3, 40),
    Coin(4, 25),
  ];

  @override
  Widget build(BuildContext context) {
    List<charts.Series<Coin, int>> expensesAndRevenueSeries = [
      charts.Series(
        id: "Dogecoin",
        data: dData,
        domainFn: (Coin pops, _) => pops.idx,
        measureFn: (Coin pops, _) => pops.value,
        colorFn: (Coin pops, __) =>
            charts.ColorUtil.fromDartColor(Color(0xfffCEE385)),
      ),
      charts.Series(
        id: "Etherium",
        data: ethData,
        domainFn: (Coin pops, _) => pops.idx,
        measureFn: (Coin pops, _) => pops.value,
        colorFn: (Coin pops, __) =>
            charts.ColorUtil.fromDartColor(Color(0xfff1C4350)),
      ),
      charts.Series(
        id: "Bitcoin",
        data: bitData,
        domainFn: (Coin pops, _) => pops.idx,
        measureFn: (Coin pops, _) => pops.value,
        colorFn: (Coin pops, __) =>
            charts.ColorUtil.fromDartColor(Color(0xfff551A55)),
      ),
    ];
    return Scaffold(
      backgroundColor: Color(0xfff1C4350),
      appBar: AppBar(
        shadowColor: Colors.transparent,
        backgroundColor: Color(0xfff1C4350),
        title: const Text(
          "Crypto Portfolio",
          style: TextStyle(
              fontWeight: FontWeight.bold, color: Colors.white, fontSize: 24),
        ),
      ),
      body: Column(
        children: [
          const SizedBox(
            height: 22,
          ),
          Container(
            padding: const EdgeInsets.symmetric(vertical: 22),
            width: MediaQuery.of(context).size.width * 0.9,
            decoration: BoxDecoration(boxShadow: [
              BoxShadow(
                color: Colors.black.withOpacity(0.5),
                spreadRadius: 1,
                blurRadius: 3,
              ),
            ], color: Colors.white, borderRadius: BorderRadius.circular(15)),
            child: Column(
              children: const [
                Text(
                  "2022",
                  style: TextStyle(
                      fontSize: 18,
                      color: Colors.black,
                      fontWeight: FontWeight.w400),
                ),
                SizedBox(
                  height: 5,
                ),
                Text("Total value Invested",
                    style: TextStyle(
                        fontSize: 22,
                        color: Colors.black,
                        fontWeight: FontWeight.w500)),
                SizedBox(
                  height: 10,
                ),
                Text("\$21,150",
                    style: TextStyle(
                        fontSize: 40,
                        color: Colors.black,
                        fontWeight: FontWeight.bold)),
              ],
            ),
          ),
          const SizedBox(
            height: 40,
          ),
          Container(
            margin: const EdgeInsets.symmetric(horizontal: 20),
            height: MediaQuery.of(context).size.height / 2,
            decoration: BoxDecoration(
                color: Colors.white,
                border: Border.all(color: Colors.grey.shade300),
                borderRadius: BorderRadius.circular(10),
                boxShadow: [
                  BoxShadow(
                    color: Colors.black.withOpacity(0.15),
                    spreadRadius: 0.5,
                    blurRadius: 2,
                    offset: const Offset(2, 3),
                  ),
                ]),
            child: Padding(
              padding: const EdgeInsets.all(5),
              child: charts.LineChart(
                expensesAndRevenueSeries,
                animate: true,
                defaultRenderer:
                    charts.LineRendererConfig(includeArea: true, stacked: true),
                primaryMeasureAxis: const charts.NumericAxisSpec(
                  tickProviderSpec: charts.BasicNumericTickProviderSpec(
                    desiredTickCount: 5,
                  ),
                ),
                behaviors: [charts.SeriesLegend()],
              ),
            ),
          ),
        ],
      ),
    );
  }
}

class Coin {
  final int idx;
  final int value;

  Coin(this.idx, this.value);
}